The Value of Personal Financial Statements for Business Owners
Running a successful business requires more than tracking company revenue and expenses. As a business owner, your personal financial position also plays…
Read article
Do you know how much cash your UAE business can actually use after accounting for customer payments due, supplier bills, and upcoming operating expenses?
A business can report strong sales and still struggle to pay suppliers on time. Slow customer collections, excess inventory, and unexpected expenses can tie up cash even when the company appears profitable.
A working capital dashboard UAE businesses can use brings these figures together in one report. It helps owners monitor short-term liquidity, identify cash-flow pressure, and make informed decisions about collections, inventory, supplier payments, and operating costs. This guide explains what a working capital dashboard should include, which KPIs to track, and how UAE SMEs can use it to improve financial visibility.
Let’s get started!
A working capital dashboard is a financial reporting tool that summarises the assets, liabilities, and operational indicators affecting a business’s short-term cash position.
It typically combines information from accounting records, bank statements, customer invoices, supplier bills, and inventory reports.
Rather than reviewing each report separately, business owners can use a dashboard to understand how much working capital is available, where cash is tied up, and which upcoming payments require attention.
Working capital is commonly calculated as:
Working Capital = Current Assets − Current Liabilities
Current assets may include cash, trade receivables, and inventory. Current liabilities may include trade payables and other obligations due within the relevant short-term period.
For example, an SME with AED 500,000 in current assets and AED 350,000 in current liabilities has net working capital of AED 150,000.
However, positive working capital does not automatically mean the business has enough cash to meet every immediate payment. Some current assets may take time to convert into cash, and inventory may not sell as quickly as expected.
This is why a useful dashboard should show both the overall working capital position and the underlying factors affecting liquidity.
For additional background, OpenStax’s guide to working capital explains the relationship between current assets, current liabilities, and daily operating cash needs.
Small and medium-sized businesses often have limited financial resources and depend on regular customer collections to fund daily operations.
A working capital dashboard can help owners identify potential issues before they become urgent.
A dashboard shows available bank balances and expected cash movements, helping management distinguish current cash from amounts that customers still owe.
This is particularly useful when payroll, rent, supplier payments, and tax-related obligations fall due around the same time.
Businesses that sell on credit may record revenue before receiving the money.
An accounts receivable report helps identify overdue invoices, customers with extended payment patterns, and amounts requiring follow-up.
Tracking supplier bills and payment due dates helps businesses plan outgoing cash without overlooking contractual obligations.
The goal is to pay suppliers according to agreed terms while preserving enough liquidity for essential operations.
For trading and retail businesses, unsold stock can tie up substantial amounts of cash.
Monitoring inventory values, stock movement, and ageing can help identify slow-moving products and purchasing patterns that place unnecessary pressure on working capital.
A dashboard can help management assess whether the business can afford additional inventory, a new hire, a marketing campaign, or an expansion plan without creating avoidable cash pressure.
It should support decisions rather than simply display historical figures.
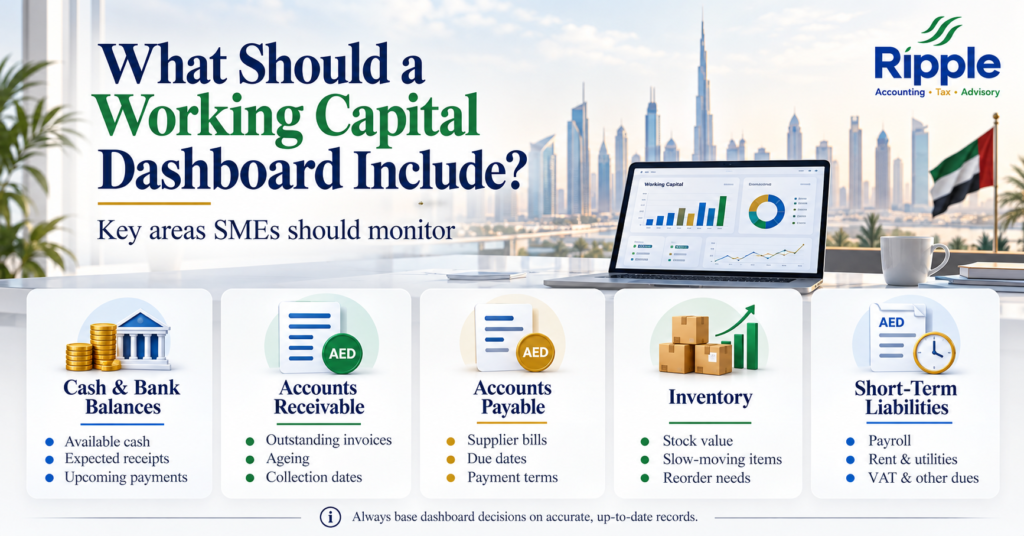
A practical working capital dashboard should combine headline figures with supporting reports that explain changes in the business’s financial position.
Start with the cash currently available across the business’s bank accounts and other relevant cash balances.
Track:
Where relevant, distinguish available funds from amounts that are restricted, pending settlement, or otherwise unavailable for immediate use.
For example, an SME may have AED 200,000 across its bank accounts but face AED 140,000 in supplier payments and AED 50,000 in payroll and operating costs during the coming week.
The business has positive cash at the reporting date, but its remaining short-term buffer may be limited.
A forward-looking cash forecast can help management assess this risk before payments become due.
Accounts receivable represents amounts customers owe the business for goods or services supplied on credit.
The dashboard should show:
An ageing report commonly groups invoices into categories such as not yet due, 1–30 days overdue, 31–60 days overdue, and more than 60 days overdue. The categories can be adjusted to suit the business’s payment terms.
This helps the finance team prioritise collection efforts.
For example, if a major customer regularly pays 45 days after the agreed due date, the business may need to follow up earlier or review its credit-control process.
Accounts payable represents amounts the business owes suppliers and other creditors.
A dashboard should include:
This information helps owners plan cash outflows and avoid overlooking important obligations.
A business should not aim to delay every supplier payment simply to improve its short-term cash position. Supplier relationships, contractual terms, early-payment discounts, and the continuity of essential supplies must also be considered.
For businesses that hold physical stock, inventory is a major component of working capital.
The dashboard can track:
A high inventory balance is not necessarily a problem if products sell quickly and support demand. However, stock that remains unsold for long periods can reduce the cash available for other business needs.
Service businesses without physical inventory can omit these measures and focus on receivables, payables, cash, and operating commitments.
Current liabilities extend beyond supplier invoices.
Depending on the business, relevant items may include:
The dashboard should reflect the relevant due dates and expected payment amounts.
Tax balances should be based on properly maintained records and the business’s actual obligations rather than rough estimates alone.
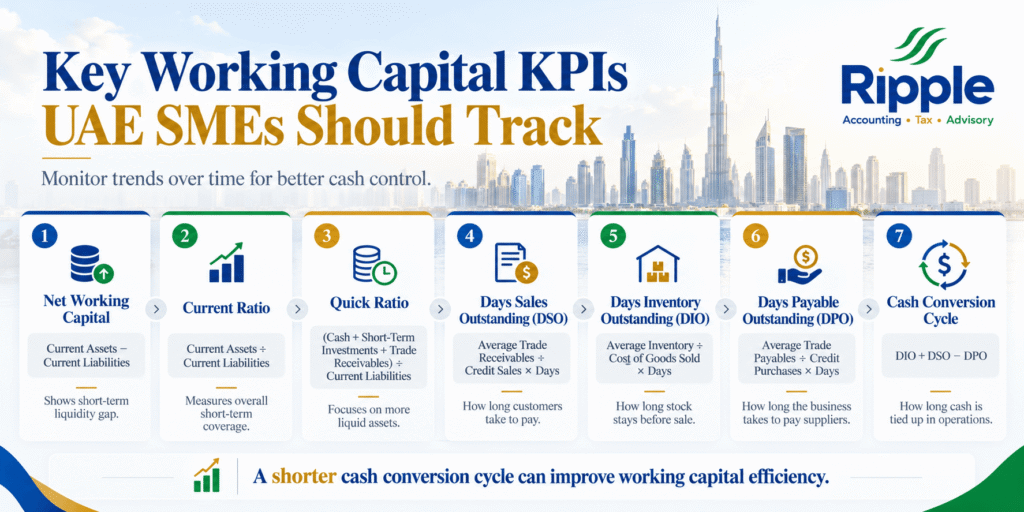
A dashboard becomes more useful when it includes indicators that reveal changes over time.
Formula:
Net Working Capital = Current Assets − Current Liabilities
This measures the difference between current assets and current liabilities.
A positive figure indicates that current assets exceed current liabilities, but management should still assess how quickly those assets can be converted into cash.
Compare the result across reporting periods and investigate significant movements.
Formula:
Current Ratio = Current Assets ÷ Current Liabilities
The current ratio measures the relationship between current assets and current liabilities.
For example, current assets of AED 500,000 and current liabilities of AED 350,000 produce a current ratio of approximately 1.43.
This means the business has AED 1.43 in current assets for every AED 1 in current liabilities.
A higher ratio is not automatically better. Excess stock or slow-paying receivables can inflate current assets without providing enough immediately available cash.
Formula:
Quick Ratio = (Cash + Short-Term Investments + Trade Receivables) ÷ Current Liabilities
The quick ratio focuses on more liquid assets and generally excludes inventory.
It can be particularly helpful for businesses that hold substantial stock or operate in sectors where inventory takes time to sell.
The exact calculation should be applied consistently and should reflect the assets and liabilities relevant to the business.
DSO estimates how long the business takes to collect its credit sales.
A common formula is:
DSO = Average Trade Receivables ÷ Credit Sales × Number of Days
For example, if average receivables are AED 150,000 and credit sales over a 90-day period are AED 450,000, the estimated DSO is:
AED 150,000 ÷ AED 450,000 × 90 = 30 days.
A rising DSO may indicate slower collections, changing customer behaviour, or weaker credit controls.
Businesses should use a consistent method and compare DSO with their actual customer payment terms.
DIO estimates how many days inventory remains in the business before being sold.
A common formula is:
DIO = Average Inventory ÷ Cost of Goods Sold × Number of Days
A high DIO may indicate slow-moving stock or purchasing ahead of demand. However, the appropriate level varies by industry, product availability requirements, and seasonal patterns.
Service businesses without material inventory generally do not need to track this KPI.
DPO estimates how long the business takes to pay its suppliers.
A common formula is:
DPO = Average Trade Payables ÷ Credit Purchases × Number of Days
Where credit purchases are not available, cost of goods sold may be used as an approximation in some analyses, but the limitation should be documented.
A longer DPO can preserve cash temporarily, but extending payment periods beyond agreed terms can damage supplier relationships or create contractual problems.
The cash conversion cycle estimates how long cash remains tied up in the operating process.
Formula:
Cash Conversion Cycle = DIO + DSO − DPO
For example, a trading business has:
Its estimated cash conversion cycle is 40 + 30 − 25 = 45 days.
This means cash is tied up in the operating cycle for approximately 45 days under these assumptions.
A shorter cycle can reduce the amount of cash tied up in operations, although management must balance efficiency with customer service, inventory availability, and supplier relationships.
Consider a UAE trading business preparing its monthly working capital report.
The following figures are illustrative and are not intended to represent industry benchmarks.
| Metric | Current position |
| Cash and bank balances | AED 180,000 |
| Trade receivables | AED 220,000 |
| Inventory | AED 250,000 |
| Other current assets | AED 30,000 |
| Total current assets | AED 680,000 |
| Trade payables | AED 190,000 |
| Other current liabilities | AED 160,000 |
| Total current liabilities | AED 350,000 |
| Net working capital | AED 330,000 |
| Current ratio | 1.94 |
At first glance, the business has positive net working capital and a current ratio of approximately 1.94.
However, the dashboard also shows AED 220,000 in receivables and AED 250,000 in inventory. The owner should therefore check how much of the receivables is overdue and whether the inventory is moving at the expected rate.
The business should also review the timing of its AED 350,000 in current liabilities.
A strong dashboard does not stop at calculating ratios. It identifies the underlying reasons for changes and helps management decide what action to take.
The right frequency depends on transaction volume, payment cycles, and the level of cash-flow risk.
Forecasts should be updated when major customer payments are delayed or significant costs change.
Profitability and liquidity are different. A profitable business can still struggle to pay its bills if customers pay slowly or cash is tied up in stock.
What to do: Monitor cash balances, receivables, payables, and upcoming payments alongside profit reports.
A dashboard based on incomplete bank reconciliations or unrecorded invoices may provide a misleading picture.
What to do: Update the underlying accounting records regularly and investigate unexplained differences.
A current ratio or DSO figure does not explain every cash-flow issue.
What to do: Compare KPIs over time, review sector-specific patterns, and identify the operational reasons behind changes.
A business may have a healthy month-end balance but face a cash shortage the following week.
What to do: Include scheduled payments, expected collections, and a forward-looking cash forecast.
Reducing stock too aggressively can cause lost sales, while delaying supplier payments may weaken important relationships.
What to do: Set realistic targets that protect cash without undermining daily operations.
A working capital dashboard is most useful when the figures behind it are accurate, timely, and connected to the business’s operating decisions.
Ripple Accounting, Tax & Advisory supports UAE businesses with financial reporting and management information designed to improve financial visibility.
Depending on the agreed scope, support may include:
For an SME managing customer credit, inventory purchases, payroll, and supplier payments, a structured working capital report can make it easier to see where cash is tied up and which issues require action.
Contact Ripple Accounting, Tax & Advisory to discuss a financial reporting process suited to your business and its cash-management needs.
Explore Ripple’s Financial Reporting Services
A working capital dashboard should generally include cash and bank balances, accounts receivable, accounts payable, inventory where relevant, current liabilities, liquidity ratios, and a short-term cash forecast. Businesses can add KPIs based on their industry and operating cycle.
Useful measures include net working capital, the current ratio, quick ratio, days sales outstanding, days inventory outstanding, days payable outstanding, and the cash conversion cycle. The most relevant measures depend on whether the business holds inventory, sells on credit, or operates mainly through service contracts.
Businesses with tight cash flow may benefit from weekly monitoring, while monthly reporting is useful for reviewing reconciled balances and trends. Some businesses need both weekly cash monitoring and a more detailed monthly management report.
Yes. Profit does not guarantee that cash is available when payments fall due. Delayed customer collections, excess inventory, and the timing of supplier payments can create cash pressure even when the business reports a profit.
Ripple Accounting, Tax & Advisory offers financial reporting support for UAE businesses. The appropriate reporting scope can be discussed with the team based on the company’s accounting records, management requirements, and cash-flow monitoring needs.
A working capital dashboard gives UAE SME owners a clearer view of the relationship between cash, customer collections, inventory, supplier payments, and short-term obligations. By tracking the right KPIs, reviewing reliable accounting data, and forecasting upcoming cash movements, businesses can identify pressure points earlier and make better-informed operating decisions. The goal is not simply to maintain positive working capital. It is to ensure that the business can meet its obligations while supporting sustainable growth.
Need clearer visibility into your business finances? Contact Ripple Accounting, Tax & Advisory to discuss financial reporting and working capital monitoring for your UAE SME.a
Disclaimer: This article provides general financial and accounting information and does not constitute professional advice. KPI definitions, calculations, and appropriate targets may vary by industry and business model. Consult a qualified accounting or financial professional for guidance specific to your business.
Tell us a little about your business and our UAE tax experts will get back to you with clear, practical answers — no obligation.
 Bookkeeping
Running a successful business requires more than tracking company revenue and expenses. As a business owner, your personal financial position also plays…
Read article Audit
Financial fraud can happen in businesses of any size, from startups to multinational corporations. As the UAE continues to strengthen its regulatory…
Read article Bookkeeping
 is one of the most important functions in any business, yet it is often overlooked by small and medium-sized enterprises (SMEs).…
Read articlePage 57 of 58
Book a free consultation and get clear answers for your business.
0 Comments